I just can’t stop writing about infographics. They teach people, tell stories, and compel with powerful information—which is hard to do in today’s age of information overload. Since the majority of people learn things visually (I myself am certainly a visual learner), the subject is as topical as ever.
Recently I’ve been presenting webinars on infographics for audiences at nonprofits, institutions and foundations. Here are the top three recurring audience questions:
1. Can our organization make infographics in-house?
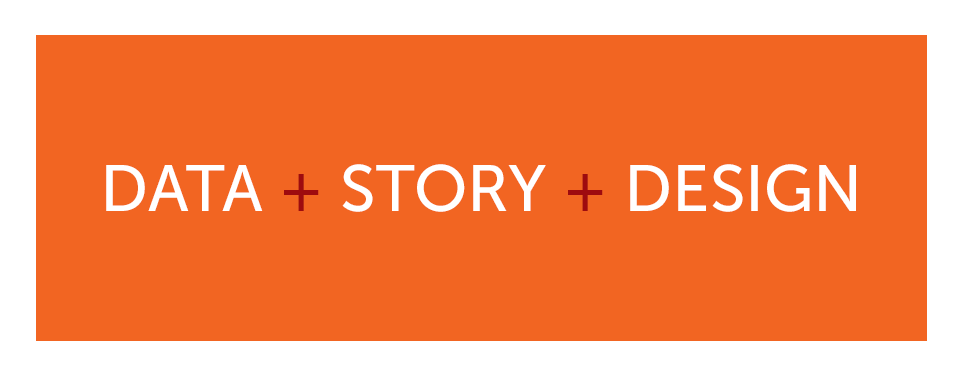
It can take quite a bit of time and expertise to create a good infographic. You will need drawing, data visualization, marketing, and storytelling skills, because an infographic is a marriage of data, story, and design. The raw data lacks the story, while the story is the overview of the situation, but it lacks the visual design. Since it can be difficult to find that one perfect person who can do it all, hiring a creative team willing to collaborate with your in-house content creator might be the best approach.
On the other hand, if you’re determined to DIY – an effort I applaud – here are a few helpful resources:
- Learn more about the topic. Read Visualising Information for Advocacy by Tactical Tech.
Through over 60 examples of visual information campaigns from around the world we show how they capture attention, present stories and take us on journeys through data.”
Bonus! Upon arrival in the mail, the book is really fun to unwrap.
- Take a class. Sign up for Beginning Infographics: Information Driven Storytelling at skillshare.com
- Look at lots of examples. Check out well-known NPO consultant Beth Kanter’s curated Pinterest Board, the site visual.ly, and the collection at GOOD magazine.
2. What’s the best software program to use?
At Stone Soup we use Adobe Illustrator, the design industry standard for vector software. In a vector graphic, every line is a point connected with an angle of a curve. You can scale a drawing to the size of a blue whale and you won’t lose a single detail.
I wouldn’t recommend designing your infographic in Adobe Photoshop, since this is a raster-based software program. A raster image is made of thousands of little dots, or pixels. Raster images cannot be scaled up in size because they will look pixelated (blurry). Photoshop is best for rendering rich, full-color photographs. Which is not to say you can’t include photographs in your infographic – I’ve seen this done to nice effect.
3. Are there infographic templates?
There are indeed templates available, but we haven’t used them here at Stone Soup—so please consider the following as helpful resources rather than recommendations:
…
Whether you choose to do-it-yourself, or hire a design partner to help—infographics make your organization’s information more engaging and connective for visual learners and busy people (a.k.a. everybody).
If you need a partner to help you connect data + story + design, or you have questions that weren’t answered here, Stone Soup Creative can help.
And if you’d like to do a workshop on infographics for your audience (or one of the other topics we excel at), let’s talk.