infographics_resources_JuliaReichDesign
If your organization is like most, you have piles of data that you think would be helpful to your readers and supporters. But who wants to wade through a 50 page report filled with statistics?
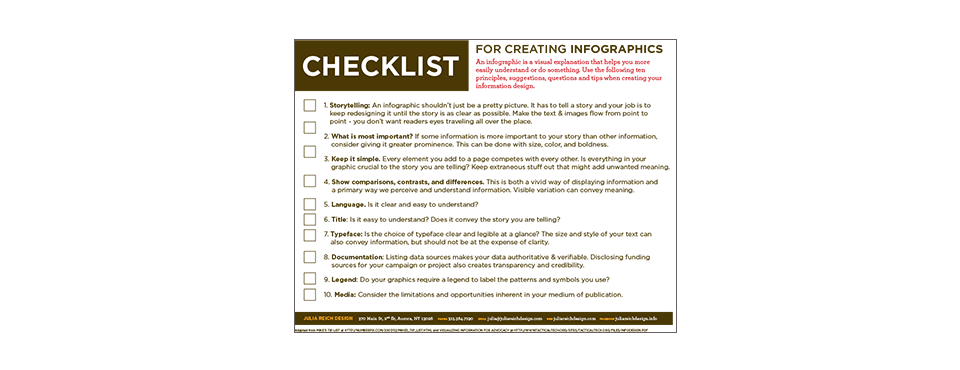
Information design and data visualization can turn your organization’s pile of data into understandable visuals, giving your constituents the right information to make choices, learn something new, or engage in a campaign.
These visuals need to be well-designed, since good design helps non-profits clearly explain needs and goals. They also need to be backed with substantial data that defines them. Your organization will be better positioned to solve the world’s problems if your infographics are clear, compelling, and convincing.


